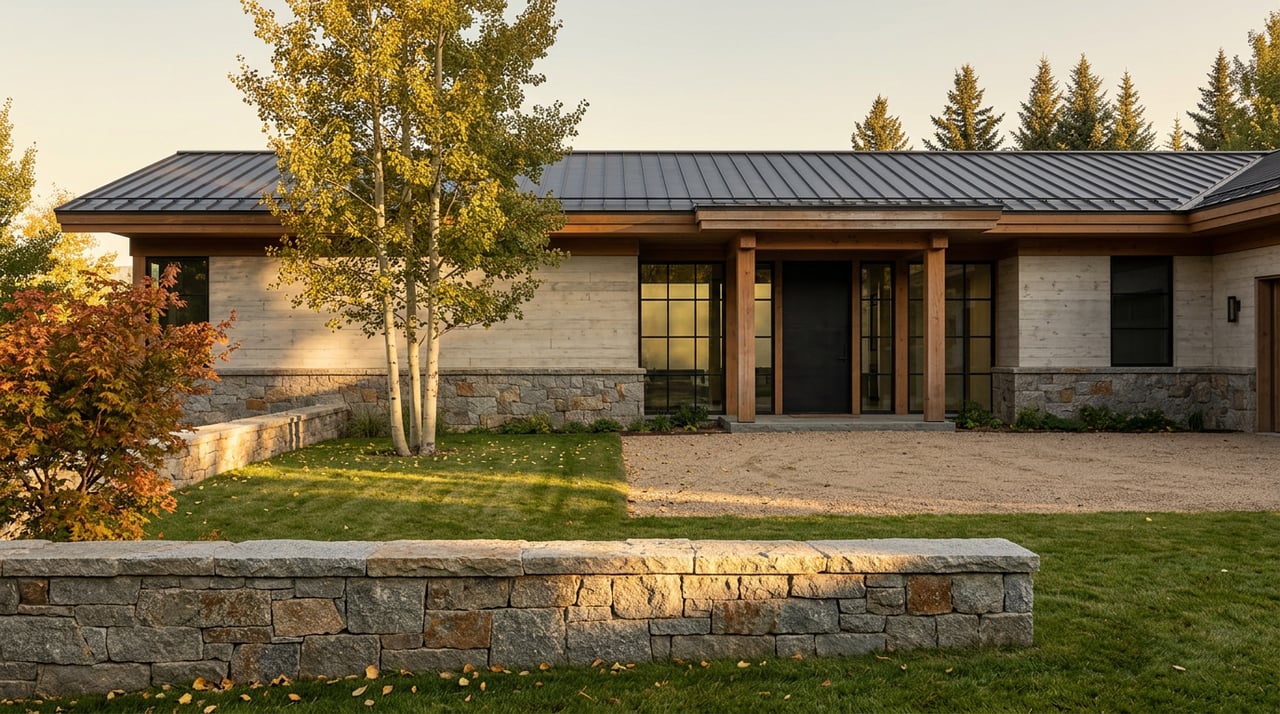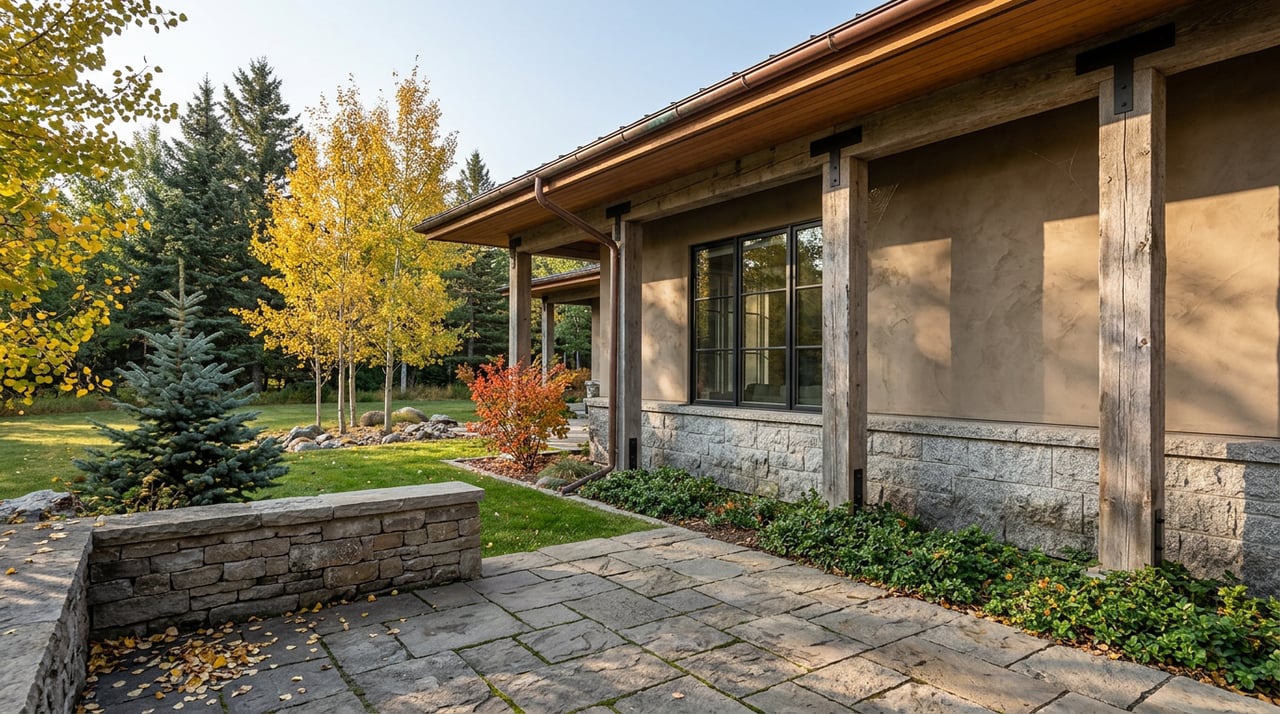
In April 2024, a 22,405 square foot estate at 419 Willoughby Way closed for $108 million. The buyers, casino magnate Steve Wynn and financier Thomas Peterffy, paid in cash, and the deal closed off-market, without ever appearing on the open listing service. It became Colorado's all-time residential sales record, and it still holds that title.
It also did something else. It became the single most consequential number in how Red Mountain's real estate market gets talked about a full year later, long after the property changed hands.
The Average That Doesn't Mean What It Looks Like It Means
Look at Red Mountain's numbers and the story seems obvious. The neighborhood's average sale price ran $32.09 million in 2024. In 2025, it came in at $22.38 million, a drop of roughly 30 percent. On a mountain nicknamed for its billionaire buyer pool, that kind of swing reads like a cooling market, maybe even the start of a correction at the very top of Aspen's price ladder.
Here is the same year measured across four of Aspen's high-end neighborhoods:
| Neighborhood | 2024 Average | 2025 Average | Change |
|---|---|---|---|
| Central core | $6.32M | $8.47M | +34% |
| East Aspen | $10.25M | $11.96M | +17% |
| West End | $10.98M | $13.28M | +21% |
| Red Mountain | $32.09M | $22.38M | -30% |
Three neighborhoods climbed. One fell off a cliff. If you were only reading headlines, you'd assume Red Mountain lost its footing while the rest of Aspen kept moving. The actual explanation has almost nothing to do with buyer appetite for Billionaire's Mountain and everything to do with how averages behave in a market where only a handful of properties trade each year.
Why One Sale Can Move a Whole Neighborhood's Number
Red Mountain does not have enough annual transactions for an average to behave the way it does in a normal housing market. When a neighborhood sees a dozen sales a year, one $108 million closing does not get diluted by volume. It becomes a meaningful share of the total, and it drags the average for that entire year upward with it. Once that specific sale rolled out of the comparison period, the 2025 average had nothing left to inflate it, so it looked like a collapse even though nothing about demand for Red Mountain estates actually changed.
Local market trackers who follow Pitkin County closings have started calling this a compound-buying dynamic, sometimes shorthanded as a billionaire effect. Very wealthy buyers don't always purchase a single home. They sometimes acquire adjacent lots, a condo for staff, or nearby commercial space in the same stretch of months, and those purchases cluster in ways that can distort a small-sample average in either direction, up one year and back down the next, without reflecting a genuine shift in the number of buyers competing for a given address.
It helps to remember that Aspen's ultra-luxury tier is also almost entirely a cash market. More than seven in ten transactions closed without financing, according to year-end 2025 market data, which means these swings aren't driven by rate sensitivity or lending stress the way they might be in a more typical market. They're driven by which handful of properties happened to trade in a given twelve months, full stop.
The Quieter Story: West End's Steady Climb
While Red Mountain's number was doing its statistical disappearing act, the West End was putting together a much less dramatic, much more durable run. Average prices there moved from $10.98 million in 2024 to $13.28 million in 2025, a climb that didn't depend on any single outsized closing to hold up.
Part of the reason is structural. The West End sits inside the jurisdiction of Aspen's Historic Preservation Commission, which caps square footage hard relative to lot size. Buyers there aren't competing to build the biggest possible footprint the way they might elsewhere in town. They're competing on interior finish, below-grade square footage, and how well a historic Victorian shell has been reworked inside those fixed limits. That constraint tends to produce steadier, more incremental pricing than a neighborhood like Red Mountain, where a handful of irreplaceable, grandfathered estate-scale lots can each single-handedly define a year's numbers.
The central core and East Aspen told a similar version of that steadier story, both posting solid gains without needing an outlier sale to explain them. If you're comparing neighborhoods on the theory that a rising average signals rising demand and a falling one signals the opposite, Red Mountain is the neighborhood in this data set that will actively mislead you.
What Changed by Mid-2026
The pattern hasn't reversed itself. Through the first half of 2026, combined dollar sales across Aspen and Snowmass fell 51 percent year over year, the slowest first half since the 2020 to 2021 window. Sales above $20 million, the exact tier that drives Red Mountain's numbers, dropped from 16 transactions in the first half of 2025 to 12 in the same stretch of 2026, a 25 percent decline in transaction count.
That thinning transaction count matters for anyone trying to read a neighborhood average going forward. Fewer closings means each individual sale carries more weight in whatever number gets published at year's end. A single high or low outlier in late 2026 is now more likely to swing a full-year average than it would have been in a busier year, not less. Meanwhile, the market-wide median price per square foot barely moved at all, sitting at roughly $2,934 versus $2,959 year over year, which is the clearest sign available that the underlying value of Aspen real estate held steady even as headline averages bounced around on top of it.
How to Read a Neighborhood's Price Average Before You Trust It
If you're comparing Aspen neighborhoods off a portal page or a year-end press release, a few questions will tell you more than the average itself:
- How many transactions actually happened in that neighborhood last year? A dozen or fewer means one closing can swing the number double digits in either direction.
- What did median price per square foot do, not just the average sale price? Medians resist outlier distortion in a way averages don't.
- Does the same pattern hold across three to five years, or is this a one-year story built on a single closing?
- Is the neighborhood governed by a hard cap on new construction, like the West End's historic preservation limits, or does it still have room for the kind of grandfathered, oversized estate that can single-handedly define a year's average?
None of this means Red Mountain is a worse place to buy than the number suggests, or that the West End is guaranteed to keep climbing at the same pace. It means the headline average, on its own, isn't built to answer either question. If you're weighing a specific Aspen neighborhood against another, a proper home valuation that accounts for actual comparable closings will tell you far more than a single published average ever will, and if you're on the seller's side of that same neighborhood question, the mechanics of pricing accurately against a thin comparable set are worth understanding before you set a list price.
A Few Questions Worth Asking Directly
Does a falling average mean now is a good time to buy on Red Mountain? Not necessarily on price. The properties that define the neighborhood, the grandfathered estate lots along Willoughby Way and similar addresses, remain scarce by design. What loosened in 2025 and into 2026 was competition for available inventory, not the underlying price ceiling for a truly comparable home.
How many sales does a neighborhood need before its average is trustworthy? There's no universal number, but anything under fifteen or twenty annual transactions in a high-end tier should be treated skeptically. Ask for the transaction count behind any average you're handed, and weigh it against the median rather than taking the average at face value.
Is the West End's rise likely to continue at the same pace? The structural reason behind its steadier climb, the Historic Preservation Commission's square footage limits, isn't going away. That doesn't guarantee continued appreciation, but it does mean the neighborhood's pricing is less exposed to the kind of single-sale swings that hit Red Mountain's numbers.
Aspen's map is full of neighborhoods that look similar on a listing sheet and behave completely differently once you understand what's actually driving their numbers. If you're trying to figure out which part of town fits your search, and which published statistics are worth trusting versus which ones need a second look, Steve Harriage has spent more than two decades working these exact transactions and is glad to walk through the real data behind any neighborhood you're considering.